Example Notebook
![]()
# # Run if on Colab
# !mkdir -p ../example_data/
# !curl -o ../example_data/lbal23_metadata.csv https://raw.githubusercontent.com/Wolfffff/chemoecology-tools/main/docs/example_data/lbal23_metadata.csv
# !curl -o ../example_data/lbal23_relative_abundance.csv https://raw.githubusercontent.com/Wolfffff/chemoecology-tools/main/docs/example_data/lbal23_relative_abundance.csv
# !curl -o ../example_data/user_provided_chemical_metadata.yaml https://raw.githubusercontent.com/Wolfffff/chemoecology-tools/main/docs/example_data/user_provided_chemical_metadata.yaml
# # Run if you have not already installed chemoeocology-tools
# !pip install git+https://github.com/Wolfffff/chemoecology-tools.git
from chemoecology_tools.core import GCMSExperiment
from chemoecology_tools.analysis import (
    calculate_enrichment_table,
    perform_nmds,
    perform_lda,
    perform_pca,
    perform_random_forest,
    calculate_compositional_stats,
)
from chemoecology_tools.visualization import (
    plot_nmds,
    plot_lda,
    plot_pca,
    plot_rf_importance,
)
USER_PROVIDED_CHEMICAL_METADATA_PATH = "../example_data/user_provided_chemical_metadata.yaml"
ABUNDANCE_DATA_PATH = "../example_data/lbal23_relative_abundance.csv"
USER_PROVIDED_SAMPLE_METADATA_PATH = "../example_data/lbal23_metadata.csv"
ID_COLUMN = "Bee #"
FILTER_DICT={
    "CHC File Located": ["NO", "Bleed"],
    "Quality": ["poor", "contaminated"],
    "Nest Code": ["E-JS-030", "E-JS-033", "E-JS-037", "E-KO-140", "E-KO-143"]
}
# Load experimental data with metadata
experiment = GCMSExperiment.from_files(
    abundance_path=ABUNDANCE_DATA_PATH,
    metadata_path=USER_PROVIDED_SAMPLE_METADATA_PATH,
    id_col=ID_COLUMN,
    filter_dict=FILTER_DICT,
    fetch_pubchem=True,
    user_chemical_metadata=USER_PROVIDED_CHEMICAL_METADATA_PATH,
)
Error fetching PubChem data for Unknown RI2496: 'PUGREST.ServerBusy'
Error fetching PubChem data for 11/13-methylpentacosane?: 'PUGREST.ServerBusy'
Error fetching PubChem data for Docosene: 'PUGREST.ServerBusy'
Error fetching PubChem data for Octacosane: 'PUGREST.ServerBusy'
Error fetching PubChem data for Tetracosanolide: 'PUGREST.ServerBusy'
Error fetching PubChem data for Nonacosene: 'PUGREST.ServerBusy'
print(experiment)
Unnamed experiment: 84 samples, 48 chemicals measured
# Filter and process data
filtered = experiment.filter_trace_compounds(threshold=0.005)
relative = filtered.calculate_relative_abundance()
filtered.metadata_df.head()
| Bee # | Nest Code | CHC File Located | All Nestmates? | Social Phenotype | Date | Reproductivity | Caste | Notes | Brood Notes | ... | Ovariole Length | Oocyte Index | DF Width | DF Length (mm) | Behavior Score | Behavior Score Subordinate Classifier | Behavioral Notes | Bead Assay | Dissection Type | CHC Notes | |
|---|---|---|---|---|---|---|---|---|---|---|---|---|---|---|---|---|---|---|---|---|---|
| 0 | 129 | A-KO-053 | yes | Yes | Solitary | 6/26/23 | Some_rep | Sol_rep | NaN | NaN | ... | 2.103 | 0.230623 | 0.531 | 3.237 | No contact | NaN | pilot assay | Pentane | RNAlater ICE | NaN |
| 1 | 135 | A-KO-055 | yes | Yes | Solitary | 6/26/23 | Some_rep | Sol_nr | NaN | 1 pupa collected, squished 2 pupa | ... | 3.148 | 0.307814 | 0.476 | 2.917 | NaN | NaN | No assay | No assay | RNAlater ICE | NaN |
| 2 | 137 | F-KO-056 | yes | Yes | Solitary | 6/26/23 | Some_rep | Sol_nr | NaN | Brood squished | ... | 2.279 | 0.237385 | 0.490 | 3.177 | No contact | NaN | pilot assay | Pentane | RNAlater ICE | NaN |
| 3 | 138 | E-SW-001 | yes | Yes | Solitary | 6/26/23 | Some_rep | Sol_rep | NaN | No brood | ... | 2.070 | 0.397101 | 0.479 | 3.480 | NaN | NaN | No assay | No assay | RNAlater ICE | NaN |
| 4 | 139 | E-SW-002 | yes | Yes | Solitary | 6/26/23 | No_rep | Sol_nr | NaN | No brood | ... | 2.133 | 0.157525 | 0.522 | 3.293 | Pass | Neutral | pilot assay, agitated with tapping and q tip | Mono alkenes | RNAlater ICE | NaN |
5 rows × 23 columns
import pandas as pd

meta_mask = filtered.metadata_df["Caste"].isin(["Sol_rep", "Sol_nr"])
chem_mask = pd.Series([
    filtered.get_chemical_property(c, "class") == "Alkane"
    for c in filtered.chemical_cols
], index=filtered.chemical_cols)
filtered_exp = experiment.filter(
    metadata_mask=meta_mask,
    chemical_mask=chem_mask
)
print(filtered_exp)
Unnamed experiment: 21 samples, 9 chemicals measured
# Combine abundance data by chemical metadata...
# combined = filtered_exp.combine_chemicals_by_feature("class")
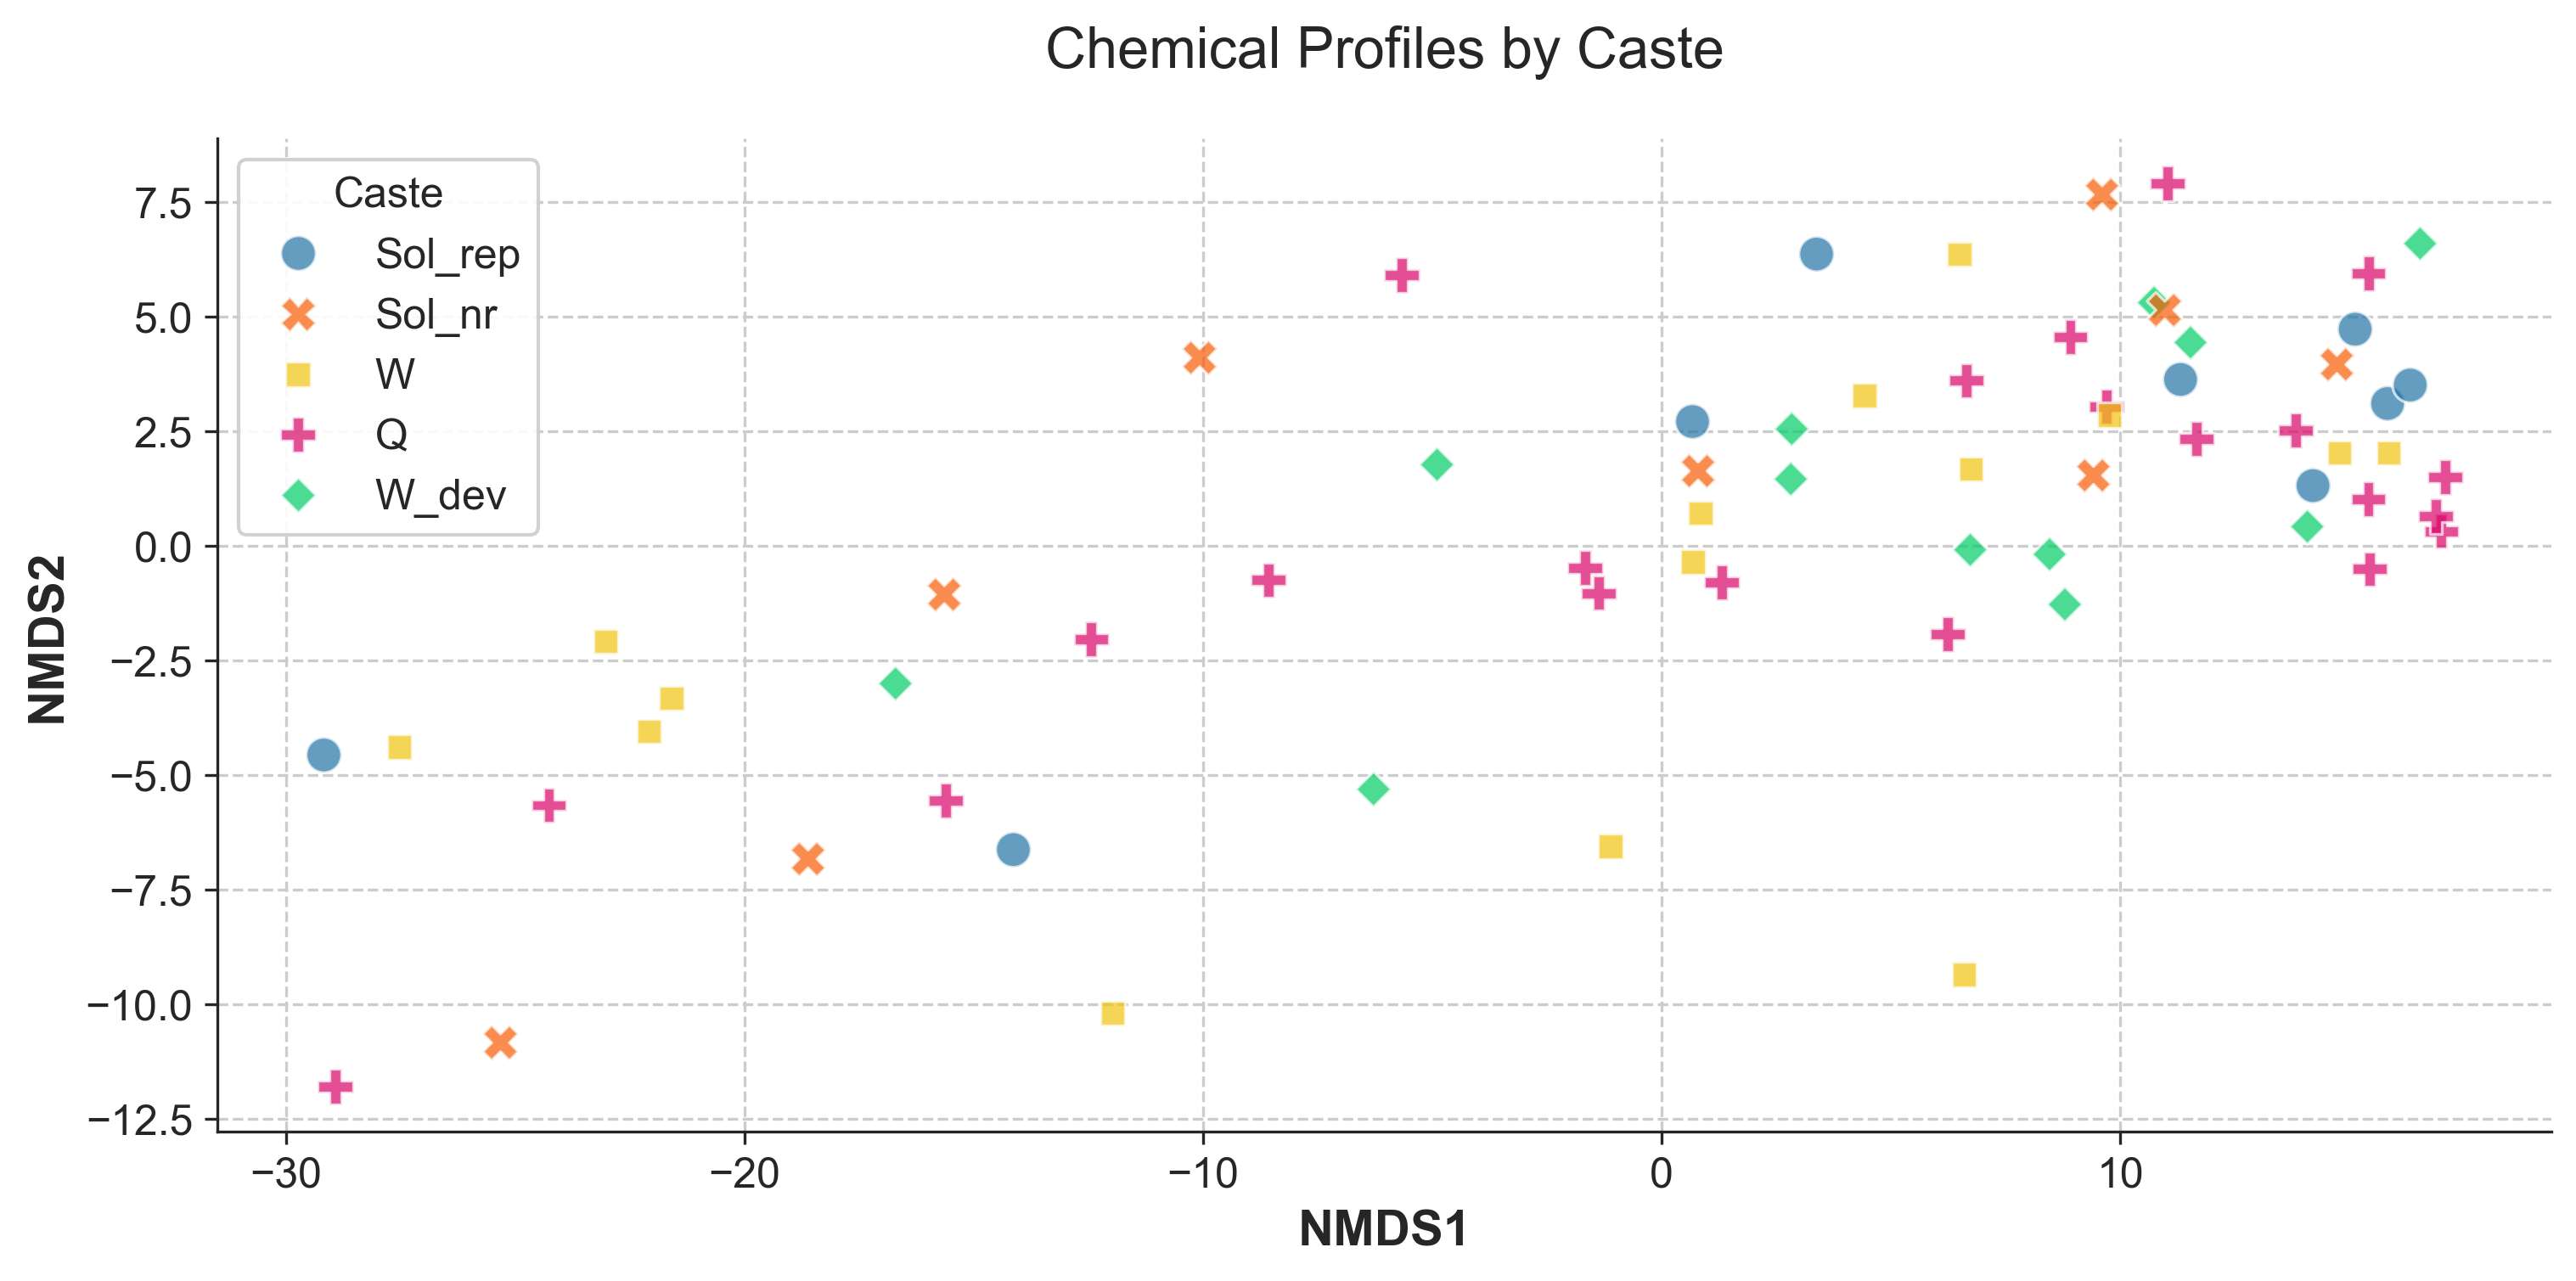
nmds_df = perform_nmds(filtered)
nmds_df.head()
| NMDS1 | NMDS2 | |
|---|---|---|
| 0 | 0.670753 | 2.710467 |
| 1 | -15.641079 | -1.063457 |
| 2 | -10.074518 | 4.100717 |
| 3 | 11.310078 | 3.628408 |
| 4 | 9.600724 | 7.657540 |
# Create plots with different groupings
# By caste
fig1 = plot_nmds(
    experiment=filtered,
    nmds_coords=nmds_df,
    group_col="Caste",
    title="Chemical Profiles by Caste"
)
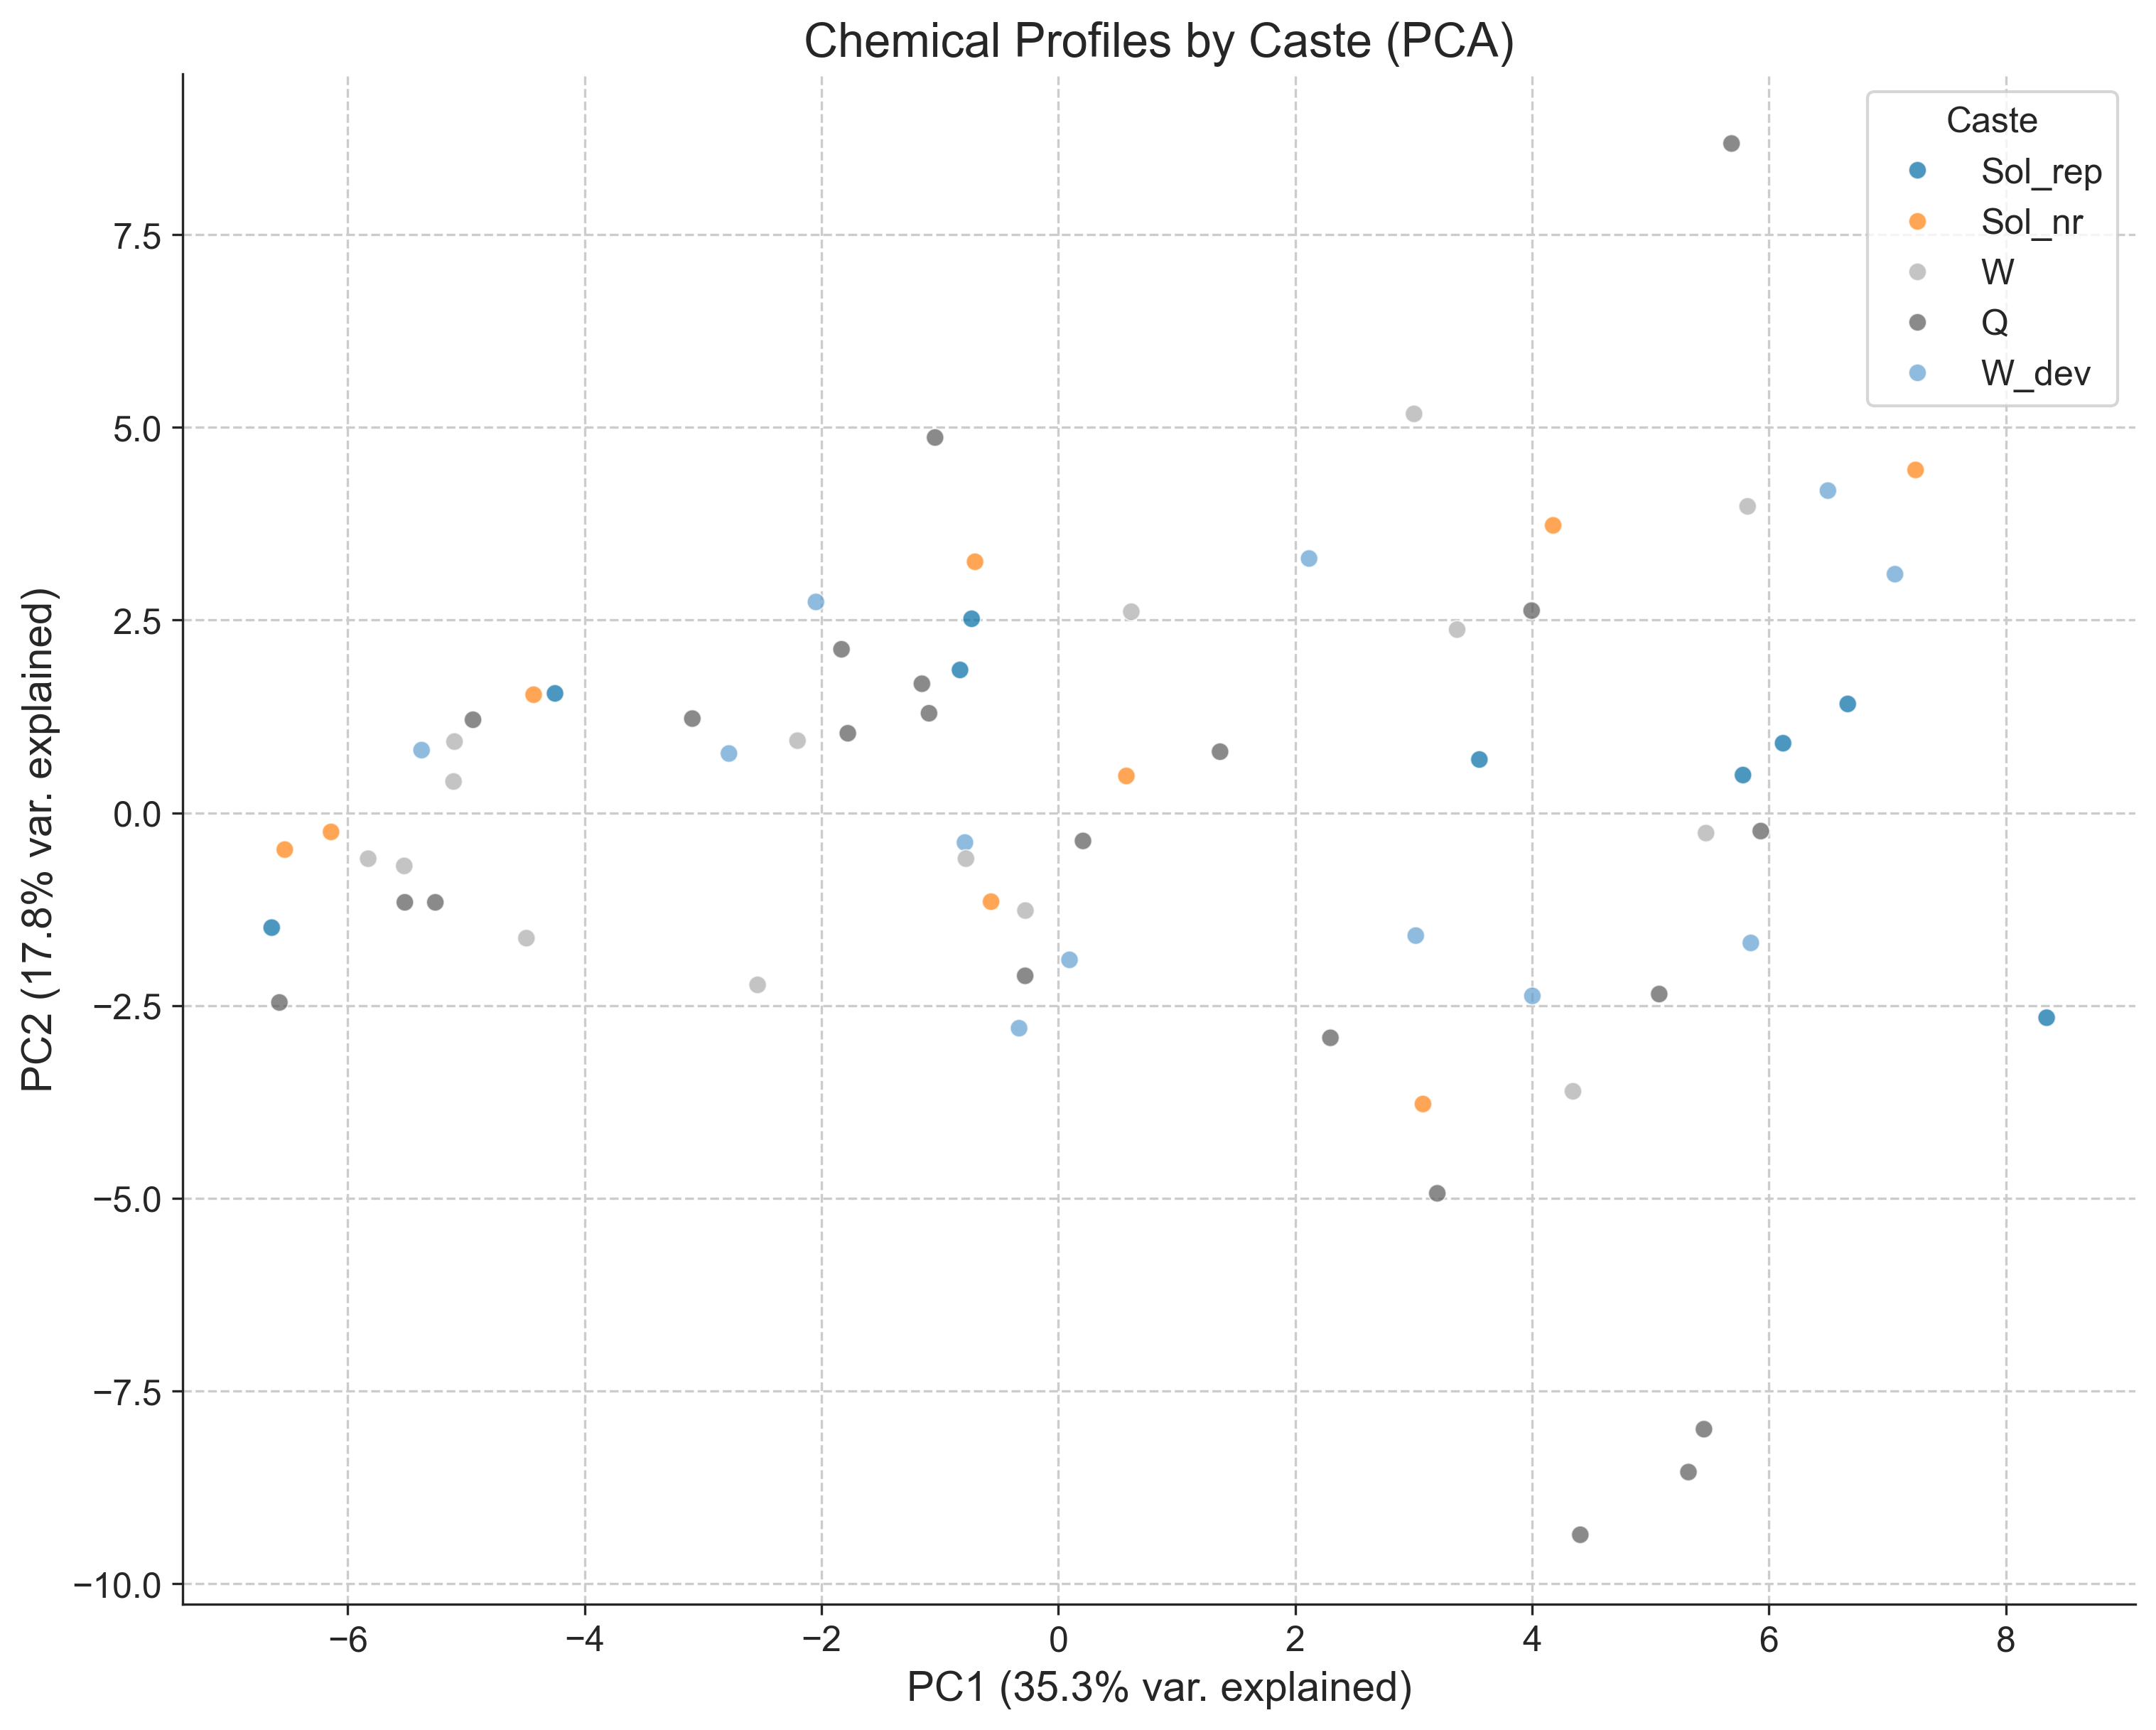
clr_output = calculate_compositional_stats(filtered)
results = perform_pca(clr_output)
pca_coords = results["coords"]
explained_var = results["explained_variance"]

print(f"PCA explained variance ratios: {explained_var}")
# Create PCA plot
fig2 = plot_pca(
    pca_results=results,
    experiment=filtered,
    group_col="Caste",
    title="Chemical Profiles by Caste (PCA)"
)
PCA explained variance ratios: [3.53162722e-01 1.78285414e-01 8.77623197e-02 6.43034507e-02
 4.81054684e-02 3.78831753e-02 2.82389037e-02 2.60710224e-02
 2.17973502e-02 1.83375154e-02 1.61620581e-02 1.37813931e-02
 1.16338884e-02 9.94672142e-03 9.10746467e-03 8.10708761e-03
 7.70011676e-03 7.28735491e-03 6.03808246e-03 5.19693220e-03
 4.75670924e-03 4.60940463e-03 4.10461136e-03 3.90091043e-03
 3.58724810e-03 2.92467841e-03 2.66686918e-03 2.26478208e-03
 1.90540880e-03 1.84722874e-03 1.53303962e-03 1.36000268e-03
 9.71077172e-04 9.04469882e-04 7.52151016e-04 6.42434388e-04
 5.64373939e-04 4.13706697e-04 3.78429755e-04 2.82229042e-04
 2.56582144e-04 1.50006025e-04 1.29181746e-04 8.19861429e-05
 5.06956306e-05 2.92965155e-05 1.40176067e-05 1.00276624e-05
 4.60168581e-31]
# Initialize group column and title prefix
group_col = "Caste"
title_prefix = "Chemical Profiles"
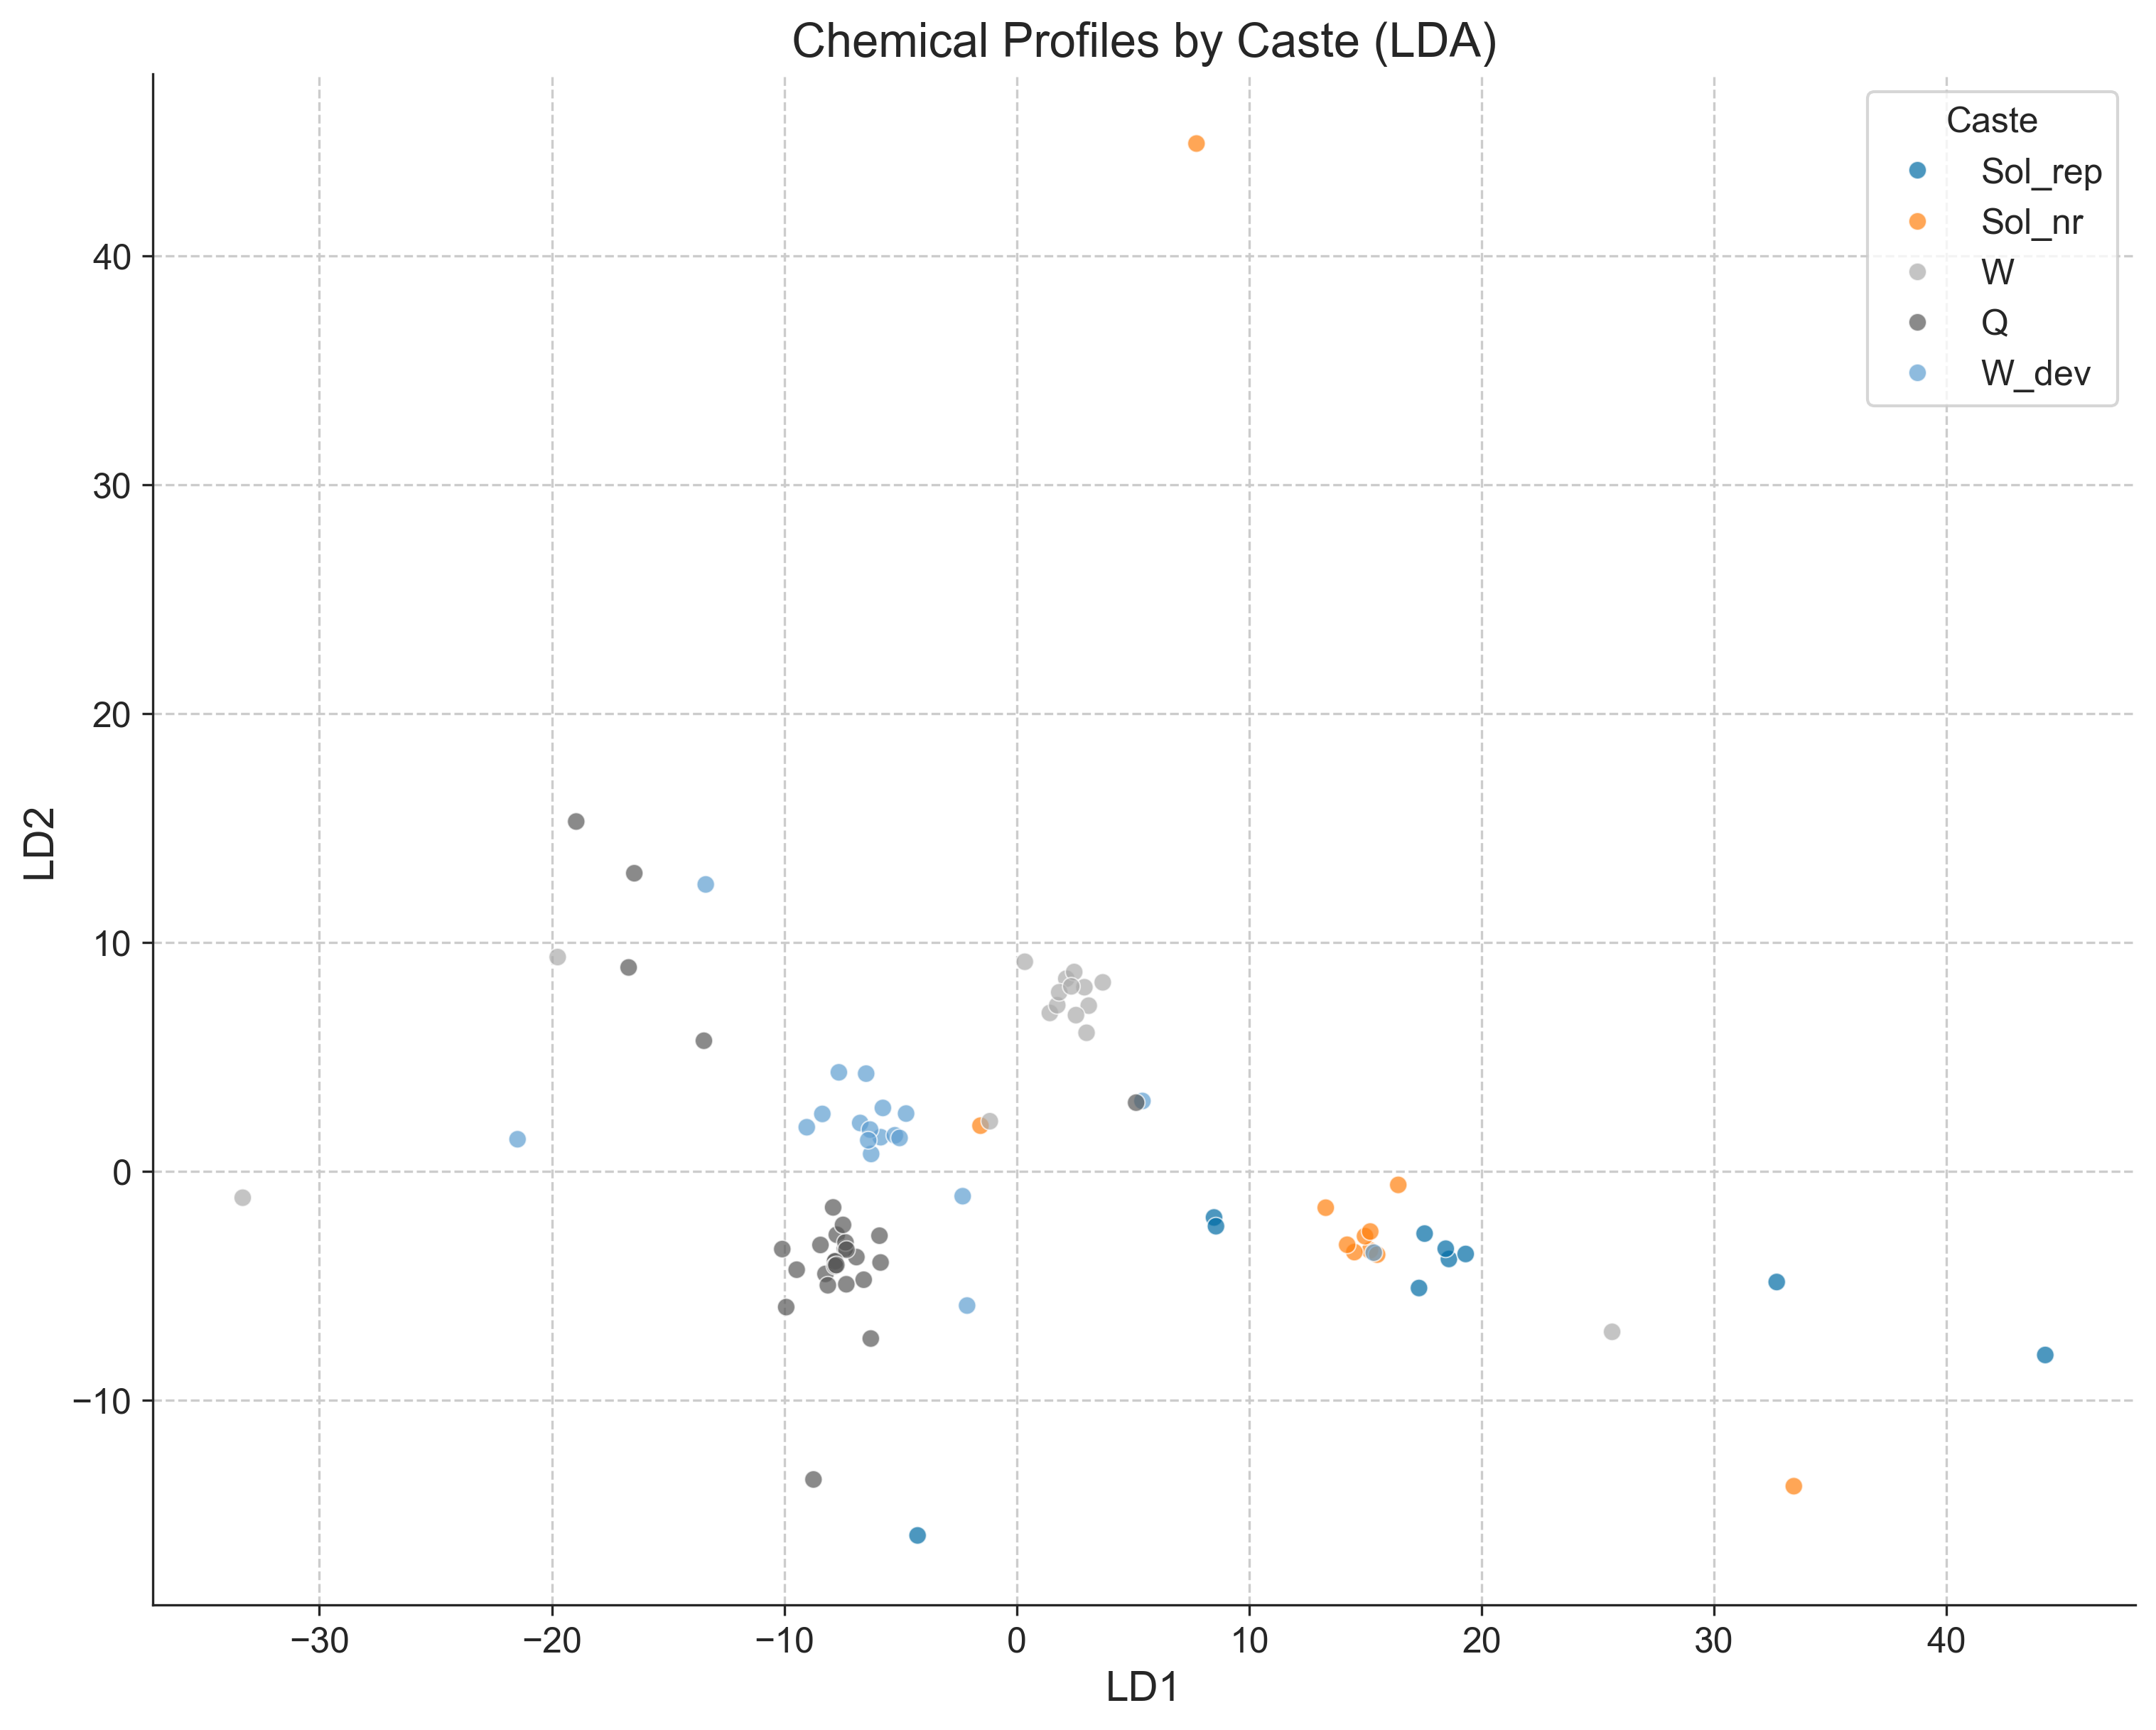
# LDA Analysis
transformed_data = calculate_compositional_stats(filtered)
lda_results = perform_lda(
transformed_data=transformed_data,
experiment=filtered,
group_col=group_col
)
fig_lda = plot_lda(
    lda_results=lda_results,
    experiment=filtered,
    group_col=group_col,
    title=f"{title_prefix} by {group_col} (LDA)"
)

pca_results = perform_pca(transformed_data)

fig_pca = plot_pca(
    pca_results=pca_results,
    experiment=filtered,
    group_col=group_col,
    title=f"{title_prefix} by {group_col} (PCA)"
)
# Generate enrichment table
enrichment_table = calculate_enrichment_table(
    experiment=filtered,
    group_column='Caste',
    class_column='class',
    alpha=0.05
)
enrichment_table.head()
| Chemical Class | Compound | KW_pvalue | Group Bias | Sol_rep | Sol_nr | W | Q | W_dev | |
|---|---|---|---|---|---|---|---|---|---|
| 7 | Aldehyde | Eicosanal | 0.249934 | 0.00 ± 0.00 | 0.00 ± 0.00 | 0.00 ± 0.00 | 0.00 ± 0.00 | 0.00 ± 0.00 | |
| 2 | Aldehyde | Octadecanal | 0.390423 | 0.00 ± 0.00 | 0.00 ± 0.00 | 0.00 ± 0.00 | 0.00 ± 0.00 | 0.00 ± 0.00 | |
| 3 | Alkane | Heneicosane | 0.000008 | Sol_nr, Sol_rep | 1.87 ± 0.58 | 1.72 ± 0.61 | 0.05 ± 0.00 | 0.09 ± 0.02 | 0.08 ± 0.02 |
| 26 | Alkane | Heptacosane | 0.043065 | W_dev | 2.29 ± 0.35 | 2.15 ± 0.33 | 2.06 ± 0.18 | 2.84 ± 0.26 | 3.35 ± 0.33 |
| 33 | Alkane | Nonacosane | 0.001116 | Q, Sol_nr, Sol_rep, W_dev | 0.24 ± 0.04 | 0.22 ± 0.04 | 0.08 ± 0.01 | 0.25 ± 0.09 | 0.22 ± 0.03 |
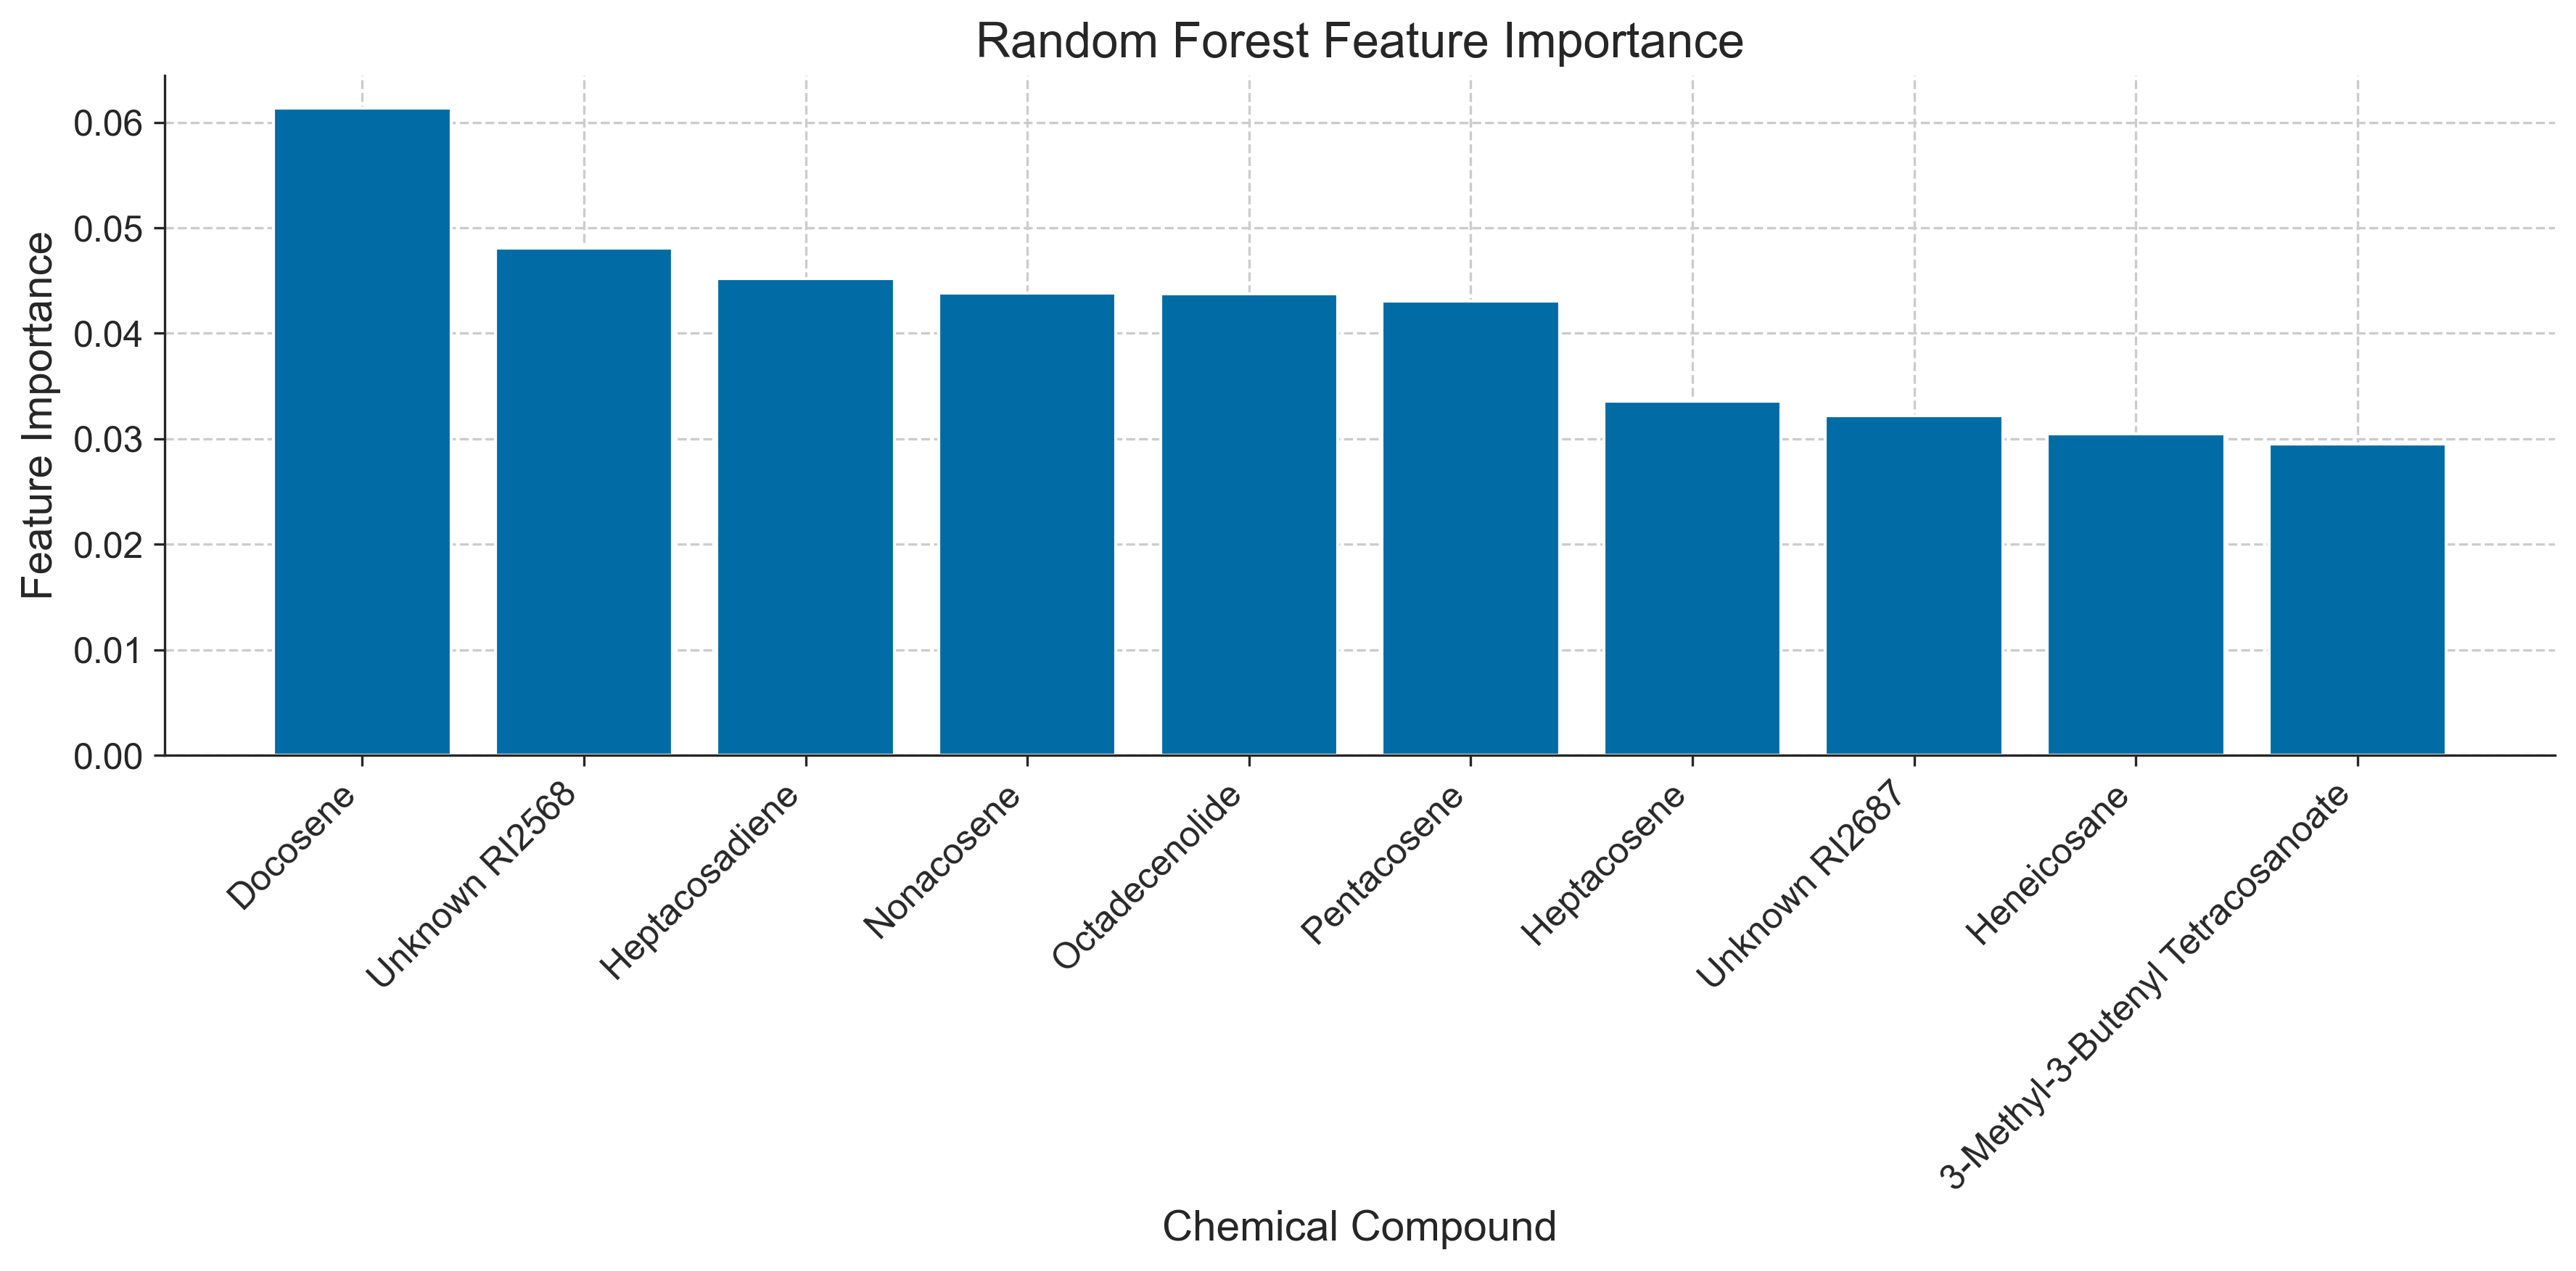
rf_results = perform_random_forest(
    transformed_data=transformed_data,
    experiment=filtered,
    group_col="Caste",
    test_size=0.3
)
rf_fig = plot_rf_importance(rf_results, title="Random Forest Feature Importance")
/Users/wolf/git/chemoecology-tools/src/chemoecology_tools/visualization/plotting.py:270: UserWarning: The figure layout has changed to tight
  plt.tight_layout()